Calendar An icon of a desk calendar. Cancel An icon of a circle with a diagonal line across. Caret An icon of a block arrow pointing to the right. Email An icon of a paper envelope. Facebook An icon of the Facebook "f" mark. Google An icon of the Google "G" mark. Linked In An icon of the Linked In "in" mark. Logout An icon representing logout. Profile An icon that resembles human head and shoulders. Telephone An icon of a traditional telephone receiver. Tick An icon of a tick mark. Is Public An icon of a human eye and eyelashes. Is Not Public An icon of a human eye and eyelashes with a diagonal line through it. Pause Icon A two-lined pause icon for stopping interactions. Quote Mark A opening quote mark. Quote Mark A closing quote mark. Arrow An icon of an arrow. Folder An icon of a paper folder. Breaking An icon of an exclamation mark on a circular background. Camera An icon of a digital camera. Caret An icon of a caret arrow. Clock An icon of a clock face. Close An icon of the an X shape. Close Icon An icon used to represent where to interact to collapse or dismiss a component Comment An icon of a speech bubble. Comments An icon of a speech bubble, denoting user comments. Comments An icon of a speech bubble, denoting user comments. Ellipsis An icon of 3 horizontal dots. Envelope An icon of a paper envelope. Facebook An icon of a facebook f logo. Camera An icon of a digital camera. Home An icon of a house. Instagram An icon of the Instagram logo. LinkedIn An icon of the LinkedIn logo. Magnifying Glass An icon of a magnifying glass. Search Icon A magnifying glass icon that is used to represent the function of searching. Menu An icon of 3 horizontal lines. Hamburger Menu Icon An icon used to represent a collapsed menu. Next An icon of an arrow pointing to the right. Notice An explanation mark centred inside a circle. Previous An icon of an arrow pointing to the left. Rating An icon of a star. Tag An icon of a tag. Twitter An icon of the Twitter logo. Video Camera An icon of a video camera shape. Speech Bubble Icon A icon displaying a speech bubble WhatsApp An icon of the WhatsApp logo. Information An icon of an information logo. Plus A mathematical 'plus' symbol. Duration An icon indicating Time. Success Tick An icon of a green tick. Success Tick Timeout An icon of a greyed out success tick. Loading Spinner An icon of a loading spinner. Facebook Messenger An icon of the facebook messenger app logo. Facebook An icon of a facebook f logo. Facebook Messenger An icon of the Twitter app logo. LinkedIn An icon of the LinkedIn logo. WhatsApp Messenger An icon of the Whatsapp messenger app logo. Email An icon of an mail envelope. Copy link A decentered black square over a white square.

Average speed cameras cut serious crashes on A9

The A9 average speed cameras

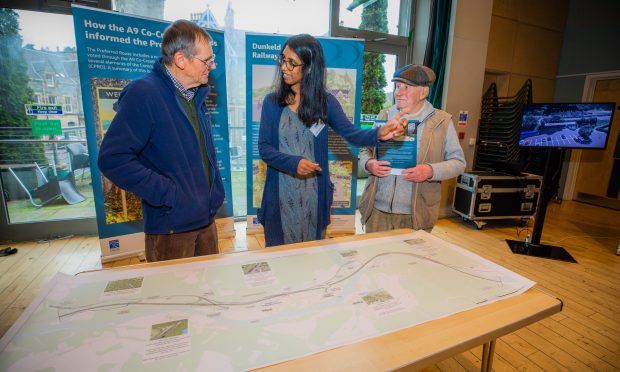
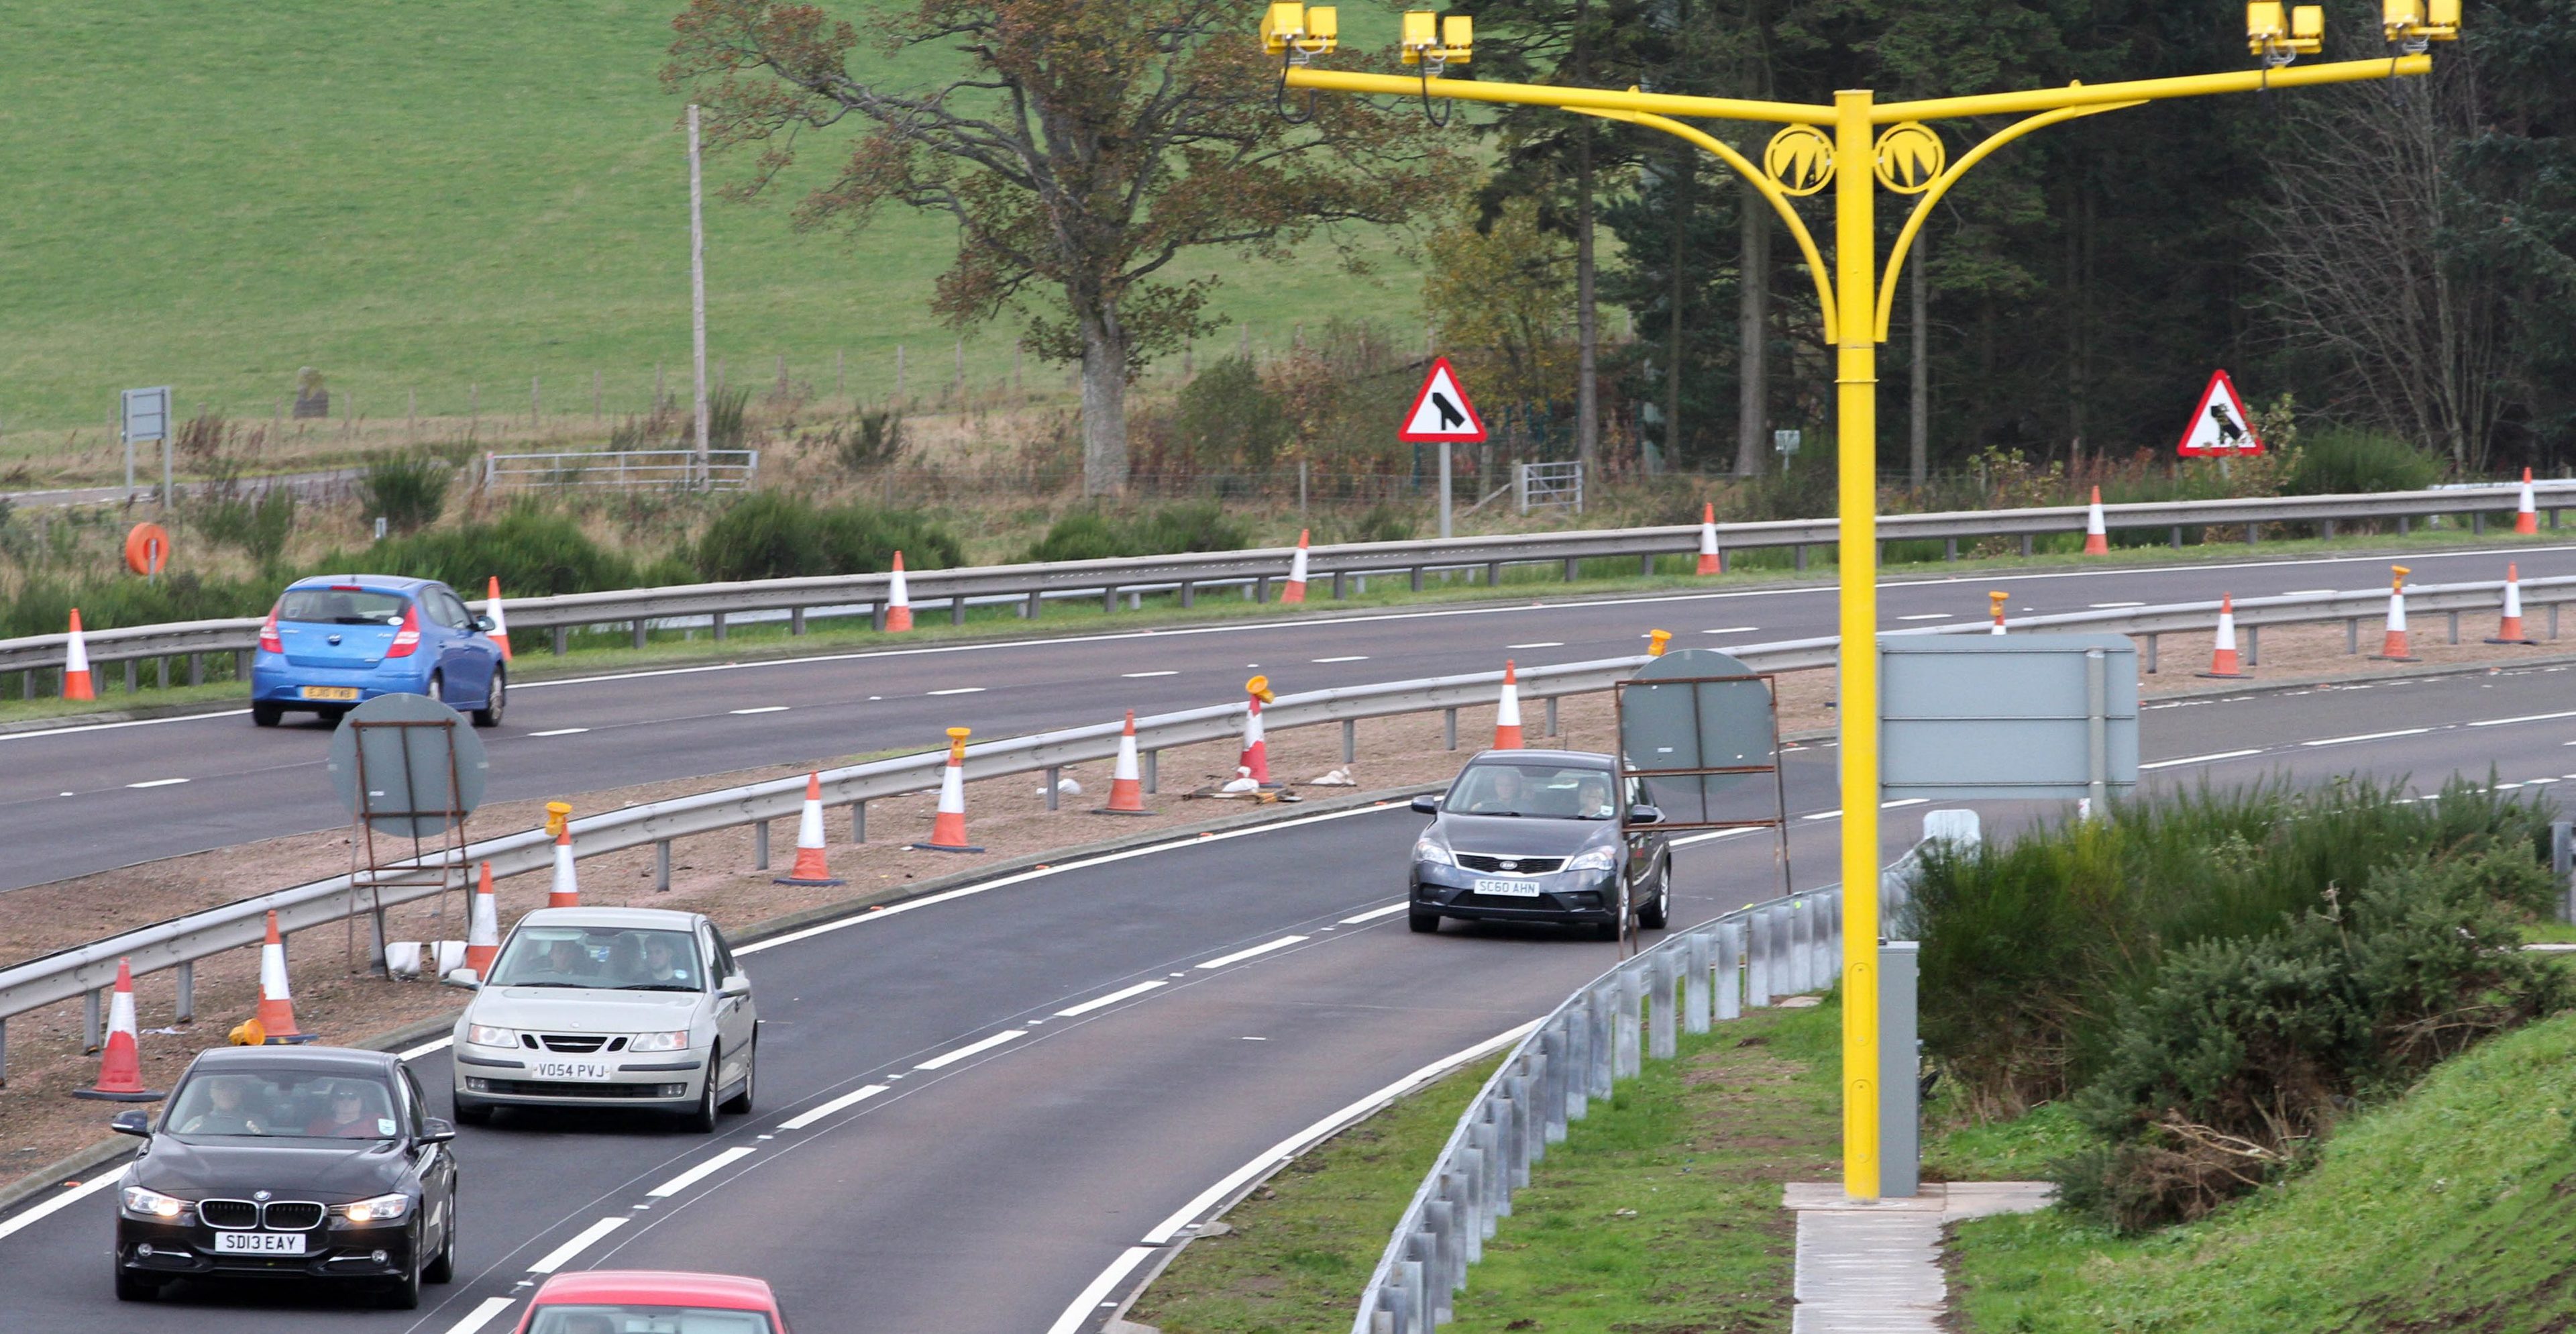
Average speed cameras have helped slash the number of fatal accidents on the A9 by a third, transport bosses have claimed.

Latest figures released by the Scottish Government show the death toll between Dunblane and Inverness has reduced by more than 30% in the first 15 months since controversial £2.5 million system was put in place.

The study also shows that the number of fatal and serious accidents combined have dropped by almost 44%.

In the time since the cameras were installed in October 2014 and January 2016, 12 people killed or seriously injured on the route.

This compares to 18 in 2013 and in 2012 and 15 in 2011.

Chairman of the A9 Safety Group Stewart Leggett said: “The A9’s improved road safety performance continues as the latest figures show the majority of drivers continue to respect the speed limits.

“With road deaths down 30% and the number of people seriously injured down over 70%, these results confirm the A9 is a safer place now than it was before the A9 Safety Group began its work.

“Fewer incidents are disrupting traffic along this key route and these improvements have been delivered against a backdrop of increasing traffic volumes and improved journey time reliability.”

The study indicates that one in 10 vehicles now travels above speed limit. Before the cameras went live, the figure was around one in three.

However, the report has been questioned by anti-average speed camera campaigner Mike Burns.

He said: “It seems to be the usual story of including the Perth and Dunblane section to hide the reality of Perth and Inverness section.

“The journey time delays are far exceeding the initial assurances that were given. The driving experience is being reported evermore frustrating by drivers to social media outlets.”

A previous study published in January shows that journey times had risen by up to nine minutes, depending on the day of the week. These numbers have stayed largely the same.

Traffic volume continues to grow by nearly 3% year on year.

The new figures come a day after research from the RAC Foundation revealed that average speed cameras now watch over more than 250 miles of road across Britain.

RAC Foundation director Steve Gooding said: “Average speed cameras are becoming a more common fixture on Britain’s roads.

“Unsurprisingly, the indications are that compliance with the speed limit through stretches of road managed by average speed cameras is high, but the acid test is whether accident and casualty rates have also fallen. That is what the next part of this research project should tell us.”