The publication of the Gers report has become an annual political event that sparks fierce debate because of what it does – and perhaps more importantly what it does not – say about Scotland’s public finances.
This year, the country’s balance sheet revealed a 22.4% gap between revenue and spending after a brutal 12 months for the economy that saw it battered by the Covid-19 pandemic and a fall in North Sea revenue.
The annual publication has become political football, with detractors of Nicola Sturgeon’s SNP government keen to seize on it as evidence of failings in the economic case for independence and the protections offered to Scotland as part of the UK.
Meanwhile, independence supporters, including Ms Sturgeon, point out that the country’s fiscal position is a feature of how it is currently governed within the UK, so perhaps an independent Scotland could fair better.
Politicians on either side of the independence debate predictably clashed again over what the report tells us as the latest figures were released on Wednesday.
What are the Gers figures?
The Government Expenditure and Revenue Scotland (Gers) report is published every year and estimates the difference between what Scotland brings in and what it spends.
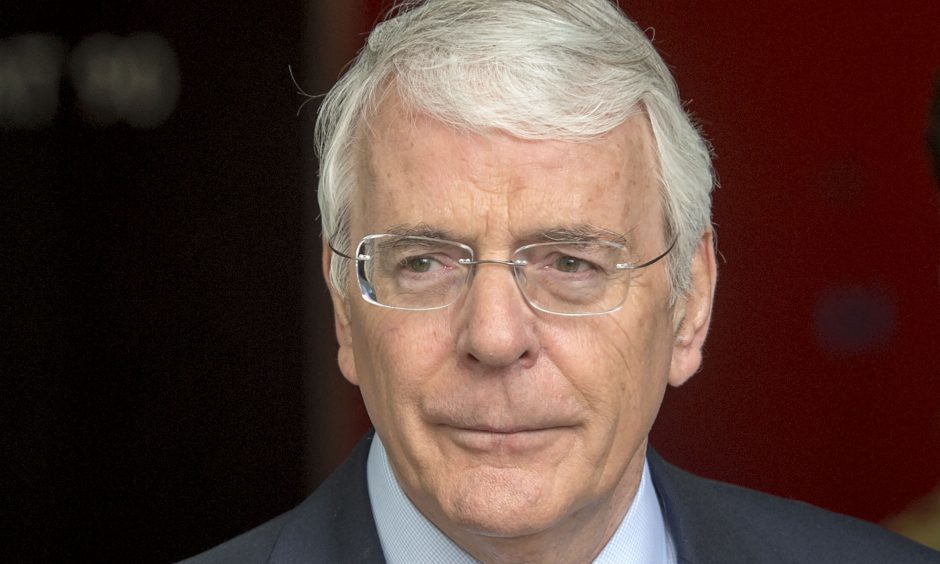
First published 1992 under then-UK prime minister John Major, the idea was that the figures would be useful for discussing the issue of devolution.
Conservative ministers in the Scottish Office believed the report would illustrate how much Scotland gains from the UK Treasury versus the tax revenues it contributes, and that this would help make the case against establishing a Scottish Parliament.
The tactic was not as successful as they would have hoped and since devolution was introduced in 1999, the figures have been compiled by Scottish Government statisticians free of political interference.
The report, despite being controversial, remains a key annual event and was described in the white paper leading up to 2014’s independence referendum as “the authoritative publication on Scotland’s public finances”.
The figures were also used as the starting point for the SNP’s Growth Commission report, which examined the financial options for an independent Scotland.
However, the Scottish Government has warned the figures are “notional” and only reflect Scotland’s finances under current constitutional arrangements, so should not be used to make the case for or against independence.
What can Gers tell us about an independent Scotland?
In short, not as much as some people would have you believe.
Opponents of Scottish independence often point to the report as evidence that Scotland is only able to maintain its levels of public spending because it is part of the UK.
Those on the other side suggest it should be seen as proof of the failure to create a successful Scotland within the union, and that it could do better on its own.
However, the figures are only an illustration of the current position in Scotland under the current political arrangements.
It is common to see the report used as evidence of the size of deficit that would befall an independent Scotland but this would only be the case if one imagines public finances being set up exactly as they are within the rest of the UK.
An independent Scotland would almost certainly look to control tax, spending and borrowing powers differently than the current set up, and that makes it more difficult to predict what the country’s finances would look like.
Nicola Sturgeon made this argument when talking about the UK Government’s coronavirus furlough scheme, which she suggested an independent Scotland could reproduce, or even improve on, with the proper borrowing powers.
This year’s report found Scotland has a deficit of 22.4%, which is more than double last year’s and the largest since the Gers figures began recording the data in 1998.
Former MP Andrew Wilson, who headed the SNP’s Growth Commission, argued Scotland should aim to reduce its deficit to under 3% within the first five to 10 years of Scottish independence.
EU countries are asked to keep a deficit below 3% of their GDP, although this limit is often broken by current members with little consequence. Whether an independent Scotland seeking to rejoin would need to meet this limit remains hotly contested.
How reliable are the figures?
The Fraser of Allander Institute previously explained how the total expenditure is made up of Scottish and local government services and some UK Government spending allocated to Scotland on a proportional basis.
That includes things such as defence and debt interest but UK welfare spending and pensions in Scotland are also included.
Scottish finance secretary Kate Forbes said this means around 40% of spending and 70% of revenue income is currently reserved to the UK Government.
Concerns were previously raised about how revenue – the money brought in through taxation and other means – was calculated because the data was largely estimated from UK figures, rather than being collected from Scotland.
This has been less of an issue in recent years because fees such as Scottish income tax, council tax, business rates, landfill tax, land and building transactions tax, and local authority fees and charges are all now included.
Estimates are not unusual in economic statistics and the Scottish Government confirmed the Gers report “has been assessed by the UK Statistics Authority as being produced in line with the Code of Practice for Official Statistics”.
It said the statistics “have been found to meet user needs, to be methodologically sound, explained well and produced free of political interference”.
A big issue in recent years has been the impact of the coronavirus pandemic. Scotland has been given a proportional share of borrowing incurred to fund projects such as the furlough scheme and other UK-wide initiatives to protect jobs.
What do this year’s figures tell us?
Scotland’s deficit more than doubled to 22.4% of GDP in 2020/21, the highest yearly figure since the Government’s annual accounts began two decades ago.
Spending increased by 21% during the year, reflecting the impact of the pandemic, while average public spending per person also rose to £1,828 above the UK average.
Scotland has historically carried a deficit because of the high level of public spending required to provide services to remote areas with smaller populations.
The Office for National Statistics now produces regional breakdowns that show outside of London and the east and south east of England, most parts of the UK raise less in revenue than is spent on their behalf.
Both the UK and Scottish deficits increased during the year, with the UK’s up by 11.6 percentage points and Scotland’s increasing 13.6 percentage points.
As well as the impact of coronavirus, the fiscal position was also affected by declining activity in the North Sea and a fall in oil prices. This led to a drop in North Sea GDP of 40%.
Total public expenditure in Scotland during 2020/21, covering both Scottish and UK government spending and the rest of the public sector, was £99.2 billion.
This is equivalent to 9.1% of total UK public sector expenditure, or £18,144 per person – which is £1,828 per person greater than the UK average.