The full horror of the carnage on the A9 is laid bare in an interactive map showing 10 years of casualties on Britain’s roads.
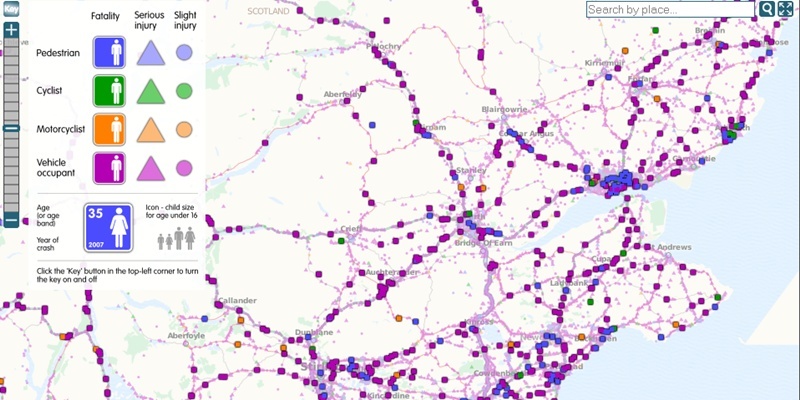
The ITO Road Casualties UK map (link) shows everyone who was killed or injured on UK roads between 2000 and 2010.
Over the first 10 years of the new millennium, 32,955 people were killed and almost three million injured. The map breaks down each incident, showing whether the victim was a pedestrian, cyclist, motorcyclist or vehicle occupant and whether it resulted in a minor injury, serious injury or fatality. Users can zoom in on the map to the level of their own street.
The A9 is Scotland’s deadliest road, with around 200 accidents a year. Between 2004 and 2010, 88 people lost their lives on it, with 14 fatalities 13 of them on the Perth-to-Inverness stretch occurring last year alone.
An inspection of the A9 north of Perth shows a steady line of fatalities with clusters of deaths on the stretches around Dunkeld, Pitlochry and Dalwhinnie.
This month, a seven-year-old boy and a 31-year-old man were killed following a crash on the A9 north of Bankfoot.
Regular switches between single and dual carriageway are seen by many as key causes of accidents many of them fatal and have led to calls for a uniform layout along its 113-mile distance.
The Courier has consistently argued to have the A9 dualled and more than 10,000 people signed a petition set up by Conservative Mid Scotland and Fife MSP Murdo Fraser calling for the road to be dualled for the entire stretch between Perth and Inverness.
Mr Fraser said: ”This latest initiative confirms that the A9 is Scotland’s deadliest road, with the highest fatality rate in recent years.
”Many campaigners, I amongst them, believe that it is essential that we see the A9 made up to dual carriageway status between Perth and Inverness.
”Only by removing the dangerous single carriageway sections will we see substantial reductions in the horrific accident statistics on this road.”
The SNP pledged to dual the road in its 2011 manifesto. However, cuts in resources and the massive construction project that is the new Forth crossing means money for other budgets is restricted and the A9 works may find themselves kicked into the long grass.
Transport Minister Keith Brown said: ”The north and the north east make an essential contribution to Scotland’s wider economy. Road safety is an absolute priority for this government and we have given a firm commitment that dualling of the A9 between Perth and Inverness will be delivered on a progressive basis.
”The £10 million scheme to dual the A9 at Crubenmore, which opened to traffic in September, is evidence of this commitment and the latest in £50 million of structural improvements delivered on the A9 since 2007.
”September also saw the opening of the Mosstodloch section of the £31.5m A96 Fochabers to Mosstodloch Bypass project. These are strategically important projects which bring benefits to local communities, improve travel for road users and promote economic growth”
The RAC’s media relations manager, John Franklin, said: ”This road casualty mapping service will be an excellent tool for road users to see exactly where the accident blackspots are on the roads they use.
”This service can only help in the fight to improve road safety and help drive down deaths and serious injuries on our roads.”
The map was released by the charity RoadPeace. The casualty data is based on Stats19 data collected by the police and made available through the Economic and Social Data Service (ESDS) and the UK Data Archive.
The map is at map.itoworld.com/roadcasualities-uk