Calendar An icon of a desk calendar. Cancel An icon of a circle with a diagonal line across. Caret An icon of a block arrow pointing to the right. Email An icon of a paper envelope. Facebook An icon of the Facebook "f" mark. Google An icon of the Google "G" mark. Linked In An icon of the Linked In "in" mark. Logout An icon representing logout. Profile An icon that resembles human head and shoulders. Telephone An icon of a traditional telephone receiver. Tick An icon of a tick mark. Is Public An icon of a human eye and eyelashes. Is Not Public An icon of a human eye and eyelashes with a diagonal line through it. Pause Icon A two-lined pause icon for stopping interactions. Quote Mark A opening quote mark. Quote Mark A closing quote mark. Arrow An icon of an arrow. Folder An icon of a paper folder. Breaking An icon of an exclamation mark on a circular background. Camera An icon of a digital camera. Caret An icon of a caret arrow. Clock An icon of a clock face. Close An icon of the an X shape. Close Icon An icon used to represent where to interact to collapse or dismiss a component Comment An icon of a speech bubble. Comments An icon of a speech bubble, denoting user comments. Comments An icon of a speech bubble, denoting user comments. Ellipsis An icon of 3 horizontal dots. Envelope An icon of a paper envelope. Facebook An icon of a facebook f logo. Camera An icon of a digital camera. Home An icon of a house. Instagram An icon of the Instagram logo. LinkedIn An icon of the LinkedIn logo. Magnifying Glass An icon of a magnifying glass. Search Icon A magnifying glass icon that is used to represent the function of searching. Menu An icon of 3 horizontal lines. Hamburger Menu Icon An icon used to represent a collapsed menu. Next An icon of an arrow pointing to the right. Notice An explanation mark centred inside a circle. Previous An icon of an arrow pointing to the left. Rating An icon of a star. Tag An icon of a tag. Twitter An icon of the Twitter logo. Video Camera An icon of a video camera shape. Speech Bubble Icon A icon displaying a speech bubble WhatsApp An icon of the WhatsApp logo. Information An icon of an information logo. Plus A mathematical 'plus' symbol. Duration An icon indicating Time. Success Tick An icon of a green tick. Success Tick Timeout An icon of a greyed out success tick. Loading Spinner An icon of a loading spinner. Facebook Messenger An icon of the facebook messenger app logo. Facebook An icon of a facebook f logo. Facebook Messenger An icon of the Twitter app logo. LinkedIn An icon of the LinkedIn logo. WhatsApp Messenger An icon of the Whatsapp messenger app logo. Email An icon of an mail envelope. Copy link A decentered black square over a white square.

House sales listings on the rise in major cities

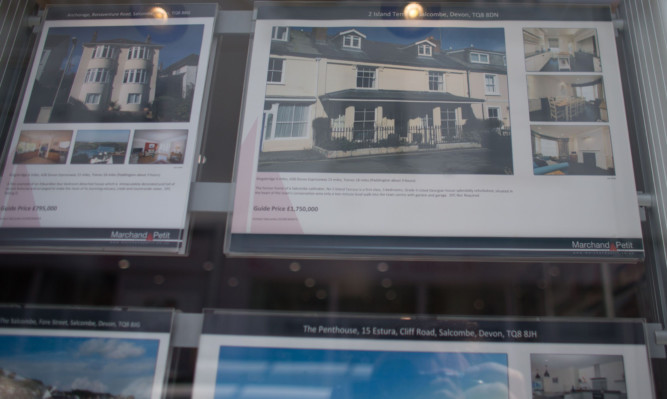
SALCOMBE, ENGLAND - JUNE 01:  Properties for sale are displayed in an estate agent's window in the seaside town of Salcombe on June 1, 2015 in Devon, England. In a recent study by the Halifax the South Devon resort is now the most expensive seaside town, overtaking Sandbanks in Dorset, with average house prices in the second-home hotspot now reaching £672,874, with prices in the town seeing a massive 69 percent rise over the past decade.  (Photo by Matt Cardy/Getty Images)
SALCOMBE, ENGLAND - JUNE 01: Properties for sale are displayed in an estate agent's window in the seaside town of Salcombe on June 1, 2015 in Devon, England. In a recent study by the Halifax the South Devon resort is now the most expensive seaside town, overtaking Sandbanks in Dorset, with average house prices in the second-home hotspot now reaching £672,874, with prices in the town seeing a massive 69 percent rise over the past decade. (Photo by Matt Cardy/Getty Images)

Home owners are starting to put their properties on the market, with a large number of towns and cities seeing an increase in new listings in the past month, according to a study.

The number of UK owners taking steps to sell has increased by 7.1% in the past month compared to the previous month, and more than two thirds (67%) of major towns and cities have seen a rise in the number of new properties being marketed in the same period.

Online estate agent HouseSimple.com has compiled a Property Supply Index looking at the number of new properties listed every week on the property portal Rightmove, in more than 100 major towns and cities across the UK and all the London boroughs.

The figures also reveal a distinct north/south divide, with owners in the north of England and Scotland appearing to be more active in June and July in marketing their properties.

Nine out of 15 of the new property listings risers are in the north of England or Scotland, while four towns or cities in the Midlands also feature in the list.

Although the Wiltshire town of Swindon, in south-west England, has seen the biggest rise (47.3%) in new property listings in the past month, Oxford (17.5%) is the only other city in the south to feature in the list of biggest risers.

Winchester, in south east England, has seen new listings fall dramatically by 17.9% in the past month, while Hull and Doncaster in the Yorkshire & the Humber region, have seen them fall by 13.7% and 12.5% respectively.

The London property market has slowed in recent months. However, the figures show that the capital has seen an 8.1% increase in new properties being listed in the past month compared to the previous month. More than three quarters (78.1%) of London boroughs have seen an increase in new properties being marketed in the past month.

The biggest rises in new property listings in the capital have been in the boroughs of Bexley (30.6%), City and Westminster (29.5%), Islington (28.8%) and Southwark (27.1%), while the biggest fallers have been Bromley (11.2%), Kingston upon Thames (6.6%) and Havering (4.4%).

Alex Gosling, chief executive of HouseSimple.com said: “A stampede of sellers coming to market was expected after the General Election result, but that stampede never materialized.

“In fact, for the first few weeks there appeared to be a fair amount of caution and reluctance amongst sellers to market. This may have been a case of waiting to see if property prices might start to rise rapidly with the confidence generated by a stable, majority government. Now it appears sellers have waited long enough, and we’re starting to see some movement.

“New stock levels are still quite low, but it will be reassuring for the market to see that two thirds of UK towns and cities have seen stock levels rise in the past month.

“The market still needs more stock to temper house price growth. One of the reasons why prices haven’t cooled, and are seemingly on a relentless upwards trajectory, has been a lack of new properties coming on to the market, especially in London. Hopefully, we’re going to start seeing a rebalancing of supply and demand.”

Biggest percentage rises in new listings in the past month as against the previous month: Swindon 47.3; Liverpool, Leicester 30.4; Lancaster 24.3; Sunderland 22; Halifax 21.5; Coventry 21.1; Hereford 19; Lincoln 17.6; Oxford, Dundee 17.5; Edinburgh, Blackpool 17.2; Hartlepool 17.1; Bolton 16.3.

Biggest percentage falls in new listings in the past month as against the previous month: Winchester 17.9; Hull 13.7; Doncaster 12.5; Cambridge 8.7; Nottingham 8.1; Torquay 7.6; Grimsby 6.2; Norwich 5.8; Glasgow 5.7.