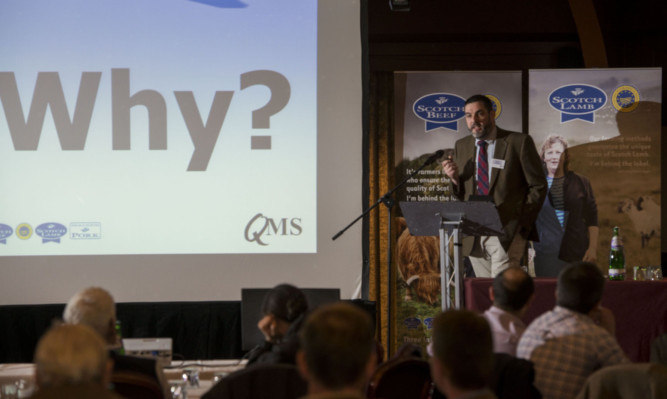
The ‘Profit Hunter’ is an elusive and unpredictable species among livestock farmers, according to Quality Meat Scotland economist Stuart Ashworth.
Opening a major QMS-organised Sharing Best Practice conference at Airth, he gave a fairly frank assessment of an industry where the gap between the performance of the top 20% of farmers and the rest has doubled over the last 20 years.
Mr Ashworth quoted an article in the Economist last month in which Dentlef Schoen of Aquila Capital wrote of agriculture: “This is an industry where the gap between the bottom quartile is greater than anywhere else”.
There were a number of reasons for this, but uptake of science could well be factor.
The unsupported pig sector was in the forefront here. Almost straight-line growth since 2006 had seen average pigs slaughtered per sow up from 19 to 26 in 2014.
In contrast, the performance in cattle and sheep enterprises was far more variable and progress was hard to find.
Delving into the figures, however, which Mr Ashworth does on a daily basis, begins to show where the differences lie.
Taking 2013 as the last complete year for which he has figures, the best producers had a yearling calf sale value, excluding Scottish Beef Calf Scheme, of £902 whereas the average was £789.
The performance wasn’t achieved at all costs, with Mr Ashworth pointing to the top quartile having lower costs across the board.
“One of the most striking aspects is the cost of herd maintenance. In 2013 it cost the average producer £83 per cow whereas it only cost the best £54. What does that tell us about our cows?” he asked.
Feed and forage and vet expenses were also lower for the top producers, with the combined effect that they could produce a positive net margin of £120 per cow. This compared starkly with the average margin of minus £102.
Mr Ashworth was quizzed as to the basis of his comparisons. They were compiled using all those who submitted data to QMS rather than including every farm in the country, so the difference between the top and the average across the industry could be more dramatic.
There will be those of course who submitted data thinking they were doing quite well only to find this wasn’t the case.
Benchmarking was therefore hugely beneficial, said Robert Gilchrist of the QMS industry development team.
It was no coincidence, he said, that a fairly damning report on UK farming competitiveness presented to this year’s Oxford Farming Conference showed Germany and New Zealand pulling ahead.
Both these countries led the field in benchmarking.
Irish data had also shown that those participating in benchmarking their performance against that of fellow farmers were producing better net margins to the tune of a significant £71 per hectare.
The first QMS benchmarking exercise, the Business Improvement Group initiative, had seen 22 groups, each with an average of 15 members meeting four times a year for three years.
A new set of eight Focus on Figures groups were now taking the concept further.
“Knowing your cost of unit production is everything,” said Mr Gilchrist.
“Everything is sold in kilograms and that is the way to look at all the figures. For example, we are seeing average costs of beef production within the groups running at around 170 pence per kilogram.”
Niall Jeffrey, Bielgrange, Dunbar, said membership of a Focus on Figures group had proved very useful on his family business with its 300 acres of arable land on the low ground and 210 Aberdeen-Angus sucklers grazed nine miles away on the Lammermuirs.
“Firstly we took three years of tax accounts and without sharing information made sure everything was allocated correctly to give a depth of data. Then we benchmarked against the QMS handbook data.
“Once we had done that the group had got to know each other well and it was time for full disclosure. There was nowhere to hide, with the calculations adjusted to account for family labour,” said Mr Jeffrey.
“It was truly beneficial to be in an open group environment, and the range of topics covered was huge.
“The only drawback is that when I go on an ordinary farm visit now I miss not seeing the accounts,” he added.
