This weekend The Observer managed to get itself involved in a bit of a debacle.
They published a story asserting as fact a statistic which had actually come from a Twitter poll.
In my day job I’m the data content lead at DC Thomson Media.
It means I follow a lot of data journalists on Twitter, so my feed was filled with derision regarding the article.
So, first and foremost, why was it an issue?
The biggest problem here is reporting the results of a poll carried out solely on Twitter as a statement of fact in the headline (“Only 8% of schools in England have received air monitors promised by government”) even if The Observer did make it clear what the statistic was based on within the body of the article.
Unbelievably this headline is based on this: a random twitter poll.
Beyond belief that a journalist, and an editor and whoever the hell else signs off on newspaper stories thought… just…well… I'm lost for words…https://t.co/3U9nUYibhW pic.twitter.com/mriRXTYh18
— Anthony Wells (@anthonyjwells) October 24, 2021
The data from the poll itself – asking if anyone had seen carbon dioxide monitors supplied to schools – has so many issues, it’s difficult to list them all here.
Twitter polls are not representative samples
Twitter polls are never going to be a representative sample.
The respondents are limited to people who happen to see the poll on their feed – so in this case largely the followers of the head teacher who posted it.
There is no way of knowing if every person who responded to the poll is an appropriate person working in education who has the required knowledge to answer the question.
Chances are a decent chunk of them weren’t.
To go from ‘only 8% of people who responded to the poll have seen a monitor’ to ‘only 8% of schools in England have received them’ is a pretty ludicrous stretch
That’s no fault of the original poster, though, as he didn’t actually even ask if the respondent’s schools had received a CO2 monitor – he simply asked if they had “seen” one.
I’ve seen a CO2 monitor in my lifetime, so if I had come across the poll I could have voted “yes”.
I clearly have absolutely nothing to do with any educational establishment, though.
See the issue?
To go from “only 8% of people who responded to the poll have seen a monitor” to “only 8% of schools in England have received them” is a pretty ludicrous stretch.
Data journalism is in the spotlight like never before
There are two industries that come to mind when I think of groups that went through a boom period during the pandemic – people who make QR code technology and data journalists.
The pandemic thrust data journalism into the spotlight in a way it never had been before.
People would wait on Twitter each night for John Burn-Murdoch of the Financial Times to post his nightly thread of charts tracking the initial trajectory of Covid-19.
Many were suddenly re-learning things they had long since forgotten (if they had ever learned them in the first place) about logarithmic scales and how to calculate seven-day averages.
As a result, data journalism completely swept the board at the 2021 Pulitzer awards and, although not quite a Pulitzer, I even won a shiny little thing myself for some of my work tracking the pandemic.
Lol pic.twitter.com/3TuTBxO6kA
— Lesley-Anne Kelly (@L_A_Kelly) September 29, 2021
Essentially, if you can say anything good came out of the pandemic, an increase in the data literacy amongst the general public is up there.
On the flip side of that, however, is that many more people can spot a clanger, like the Observer piece, than would have done previously.
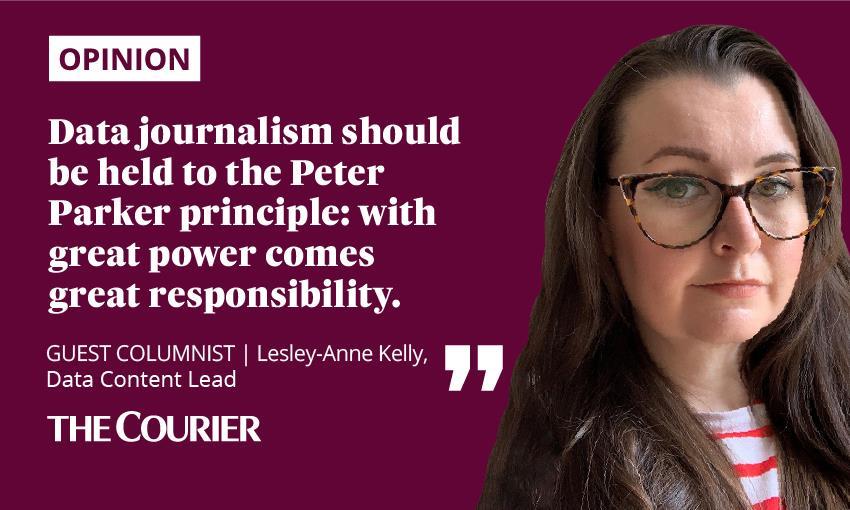
Data journalism should be held to the Peter Parker principle: with great power comes great responsibility.
The public rely on data journalists to help explain subjects that fill many people with terror – numbers.
We have a responsibility to our readers to ensure we do it right and hold our hands up when we don’t.
Lesley-Anne Kelly is data content lead for DC Thomson Media and recently won Specialist Reporter of the Year at the 2021 Scottish Press Awards