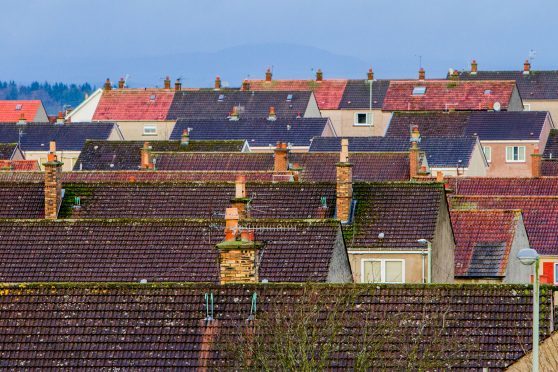
A new survey has revealed a huge property price slump in Perth.
The Fair City has topped a countdown of the weakest year-on-year growth in average house costs.
According to Halifax, Perth has seen a drop of 5.3% – the biggest fall of its kind in Britain. The city’s average house price for 2017 has come down by £10,126 to £180,687.
The study seems to conflict with a recent report compiled by Aberdein Considine.
The company’s Property Monitor analysis for Scotland found that property prices across the whole Perth and Kinross region had actually soared, with a 6.1% year-on-year increase.
Aberdein Considine said that a shortage of stock coming onto the market was inflating selling prices, with the average cost of a home at £203,398.
Halifax’s survey is based on individual towns and cities, rather than regions.
It lists Perth as the weakest for price rises, followed by Stoke-on-Trent (at -4%) and then former UK City of Culture rival Paisley at -3.6%, where the average house price has fallen to £123,665.
Halifax managing director Russell Galley said: “The majority of towns in which house prices have dropped in the last year are situated within Scotland or Yorkshire and the Humber.”
Dunfermline is fifth equal with Rotherham, reporting a -2.2% drop to £158,442.
No other place in Courier Country makes it onto the list of 20 weakest price increases, although Aberdeen has seen a decline by 2.2%.
Meanwhile, nowhere in Scotland makes it onto Halifax’s list of house price “winners”.
On the other side of the spectrum, Cheltenham, on the edge of the Cotswolds, saw the highest percentage rise in house prices of any major UK town or city in the last year.
Prices there rose at nearly five times the average UK rate during 2017, at 13% compared to 2.7% nationally.
Fifteen of the top 20 list are from London and southern England.
Halifax used its own database to calculate its findings.
Mr Galley said: “A number of towns and cities have recorded significant rises in house prices over the past year, with all of the top 20 performers recording growth of at least double the national average.
“Unlike last year, the top performers are not exclusive to London and the South-east, with the top spot now belonging to Cheltenham in the south-west, and towns in East Anglia, East Midlands, north-west England, Wales and Yorkshire and the Humber also making the list.”
The results
The 20 places which have recorded the weakest year-on-year growth in average house prices. List shows the average house price in 2017, followed by the change in cash and percentage terms.
1. Perth, Scotland, £180,687, minus £10,126, minus 5.3%
2. Stoke-on-Trent, West Midlands, £152,340, minus £6,402, minus 4%
3. Paisley, Scotland, £123,665, minus £4,593, minus 3.6%
4. Wakefield, Yorkshire and the Humber, £168,920, minus £5,076, minus 2.9%
=5. Rotherham, Yorkshire and the Humber, £140,364, minus £3,146, minus 2.2%
=5. Dunfermline, Scotland, £158,442, minus £3,535, minus 2.2%
7. Barnsley, Yorkshire and the Humber, £135,114, minus £2,238, minus 1.6%
8. Aberdeen, Scotland, £201,270, minus £2,155, minus 1.1%
9. Bromley, South East, £488,191, minus £3,192, minus 0.6%
=10. Bradford, Yorkshire and the Humber, £131,505, minus £514, minus 0.4%
=10. Leeds, Yorkshire and the Humber, £191,751, minus £728, minus 0.4%
=12. Hounslow, London, £438,497, minus £909, minus 0.2%
=12. Sunderland, North East, £144,085, minus £257, minus 0.2%
=14. Stevenage, South East, £297,737, £516, 0.2%
=14. Bolton, North West, £155,796, £330, 0.2%
16. Tower Hamlets, London, £493,855, £1,673, 0.3%
17. Harrow, London, £550,410, £3,493, 0.6%
=18. Reading, South East, £382,331, £2,636, 0.7%
=18. Bridgend, Wales, £159,091, £1,167, 0.7%
=18. Norwich, East Anglia, £239,135, £1,756, 0.7%.
And at the other end of the spectrum, the top 20 is:
1. Cheltenham, South West, £313,150, £36,033, 13%
2. Bournemouth, South West, £273,687, £28,587, 11.7%
3. Brighton, South East, £374,662, £38,289, 11.4%
4. Crawley, South East, £323,660, £30,555, 10.4%
5. Newham, London, £402,781, £37,344, 10.2%
6. Peterborough, East Anglia, £220,623, £20,314, 10.1%
7. Gloucester, South West, £231,581, £20,152, 9.5%
8. Huddersfield, Yorkshire and the Humber, £186,988, £15,981, 9.3%
9. Exeter, South West, £273,874, £22,789, 9.1%
10. Nottingham, East Midlands, £193,397, £15,884, 8.9%
11. Gravesend, South East, £312,940, £25,396, 8.8%
12. Lincoln, East Midlands, £194,723, £15,053, 8.4%
13. Stockport, North West, £235,147, £17,736, 8.2%
14. Swindon, South West, £231,316, £16,683, 7.8%
=15. Redbridge, London, £475,148, £33,981, 7.7%
=15. Swansea, Wales, £164,895, £11,774, 7.7%
=15. Barnet, London, £584,049, £41,697, 7.7%
18. Richmond-upon-Thames, London, £646,112, £45,463, 7.6%
=19. Portsmouth, South East, £222,704, £15,508, 7.5%
=19. Grays, South East, £290,422, £20,145, 7.5%
