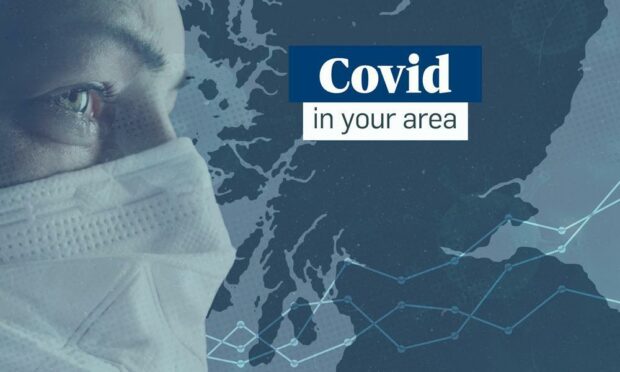
Over a month on since the now dominant Omicron variant was detected in Scotland, Covid cases have reached record highs across the country.
Due to its rapid transmission, case numbers across Tayside and Fife have doubled, and in some cases tripled, compared to the beginning of December.
The number of people in hospital and Covid-related deaths have also increased; although the extent of any rise remains to be seen as there is still some uncertainty about how high case numbers will translate into hospital admissions.
Our interactive maps below show the case rate by intermediate zone for Tayside and Fife.
Each intermediate zone (IZ), represents an area, quite often a neighbourhood, within each local authority.
Hovering over each area will give additional information including the population of each neighbourhood, how many positive cases have been recorded there in the past seven days, and the seven-day case rate per 100,000 population – a measure which is used to compare areas with different populations against each other to accurately track the spread of the virus.
Below includes details for case rates accurate as of January 3, which was the latest information at the time of writing, as this data is subject to a three-day lag in being uploaded by Public Health Scotland.
We have compared case rates to previous weeks to provide context about whether cases are rising or falling in your area.
What are the case rates like in Dundee?
The below chart shows the case rates for each neighbourhood in Dundee
Case rates have increased in each of Dundee’s 31 neighbourhoods this week, and all have recorded more than 1,000 cases per 100,000 over the seven day period.
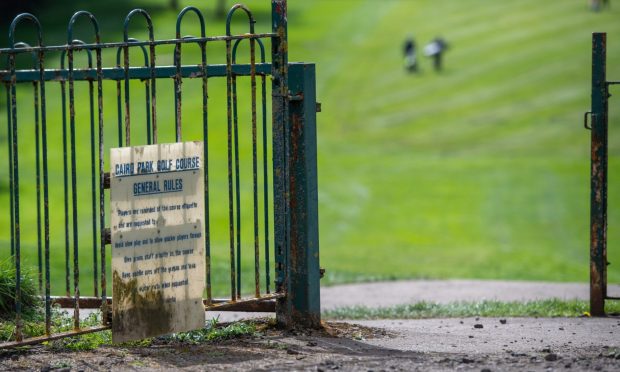
The neighbourhoods with the highest case rates in Dundee were Western Edge, West Pitkerro and Caird Park.
Western Edge had a case rate of 2,831 per 100,000 population this week, and recorded 128 positive cases in a population of 4,521. West Pitkerro had a rate of 2,638 per 100,000 population with 172 cases in 6,520 people.
Meanwhile, Caird Park saw a case rate of 2,494 per 100,000 population, and 82 positive cases per 3,288 people.
Last week, the top three neighbourhoods were Downfield, Baxter Park and West Pitkerro respectively.
What are the case rates like in Angus?
The below chart shows the case rates for each neighbourhood in Angus.
Case rates have increased in all of the 26 neighbourhoods in Angus this week, and all but three neighbourhoods have recorded more than 1,000 cases per 100,000 over the seven day period.
The three highest case rates in Angus were recorded in Montrose South, Monifieth East and South Angus.
Montrose South had a case rate of 2,662 per 100,000 population, and 145 Covid cases in its population of 5,447, while Monifieth East had a case rate of 2,455 per 100,000 population and 123 confirmed cases out of 5,011 people.
Meanwhile, South Angus had a case rate of 2,454 per 100,000 population, and 134 positive cases in a population of 5,461.
Last week, the top three neighbourhoods were Monikie, South Angus and Carnoustie East.
What are the case rates like in Perth and Kinross?
The below chart shows the case rates for each neighbourhood in Perth and Kinross.
Case rates have increased in all of the 35 neighbourhoods in Perth and Kinross this week, and all but one neighbourhood have recorded more than 1,000 cases per 100,000 over the seven day period.
In Perth and Kinross, the neighbourhoods with the highest case rates were Auchterarder, Blairgowrie East (Rattray) and Aberuthven and Almondbank.
Auchterarder had a case rate of 3,261 per 100,000 population and 135 positive cases in a population of 4,140. Blairgowrie East (Rattray) had a case rate of 2,898 per 100,000 population and 85 cases out of 2,933 people.
Aberuthven and Almondbank, the third highest area, had a case rate of 2,501 per 100,000 population and 122 positive cases in the previous seven day period, out of the 4,878 people living there.
Last week, the top three neighbourhoods were Muthill, Greenloaning and Gleneagles, Auchterarder and Scone.
What are the case rates like in Fife?
The below chart shows the case rates for each neighbourhood in Fife.
Just three neighbourhoods in Fife saw a decrease in Covid case rates this week, and 99 of the 104 neighbourhoods recorded case rates above 1,000 per 100,000 population.
This week, the neighbourhoods in Fife with the highest case rates were Leven East, Leven West and Crossgates and Halbeath.
Leven East had a case rate of 3,329 per 100,000 population, recording 100 positive cases in a population of 3,004.
Leven West had a case rate of 2,912 per 100,000 population and 108 positive cases out of 3,708 people living there. The third highest, Crossgates and Halbeath, had a case rate of 2,847 per 100,000 population with 100 positive cases out of 3,512 residents.
Last week, the top three neighbourhoods were Dunfermline Masterton, Dunfermline Touch and Woodmill and Kincardine.
How does Tayside and Fife compare to the rest of Scotland?
The below chart shows the top 10 neighbourhoods in Scotland with the highest case rate per 100,000 population.
Despite high case numbers, no neighbourhoods in either Tayside or Fife featured on the top neighbourhoods in Scotland with the highest case rates this week.